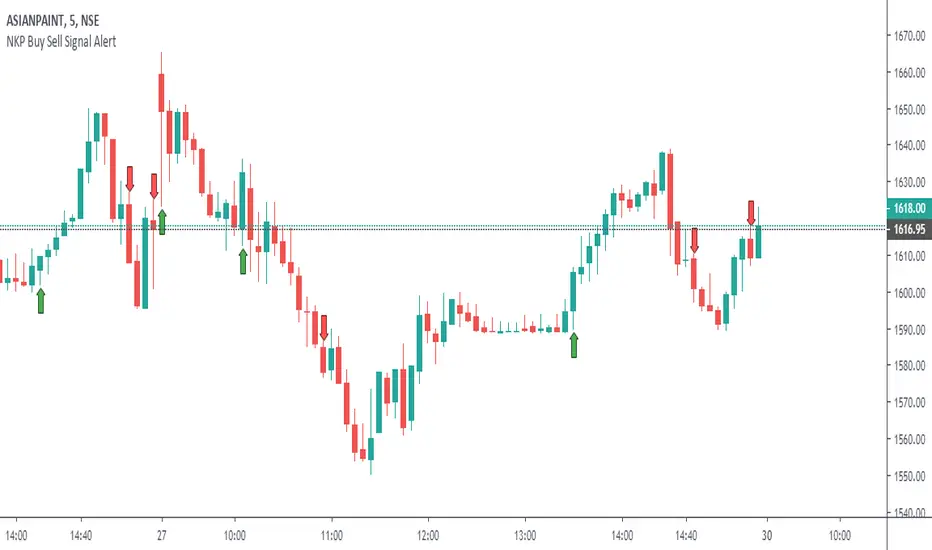
NKP Buy Sell SignalsNKP Buy Sell signal is an indicator. It will plot buy / sell signal in live market based on EMA , VWAP , RSI , PSAR, MACD generates information about entry points at close of the candle. Strong Buy/ Sell signal is the best entry point but you can enter at the next candle.
we can see signals like buy/strong buy or sell/strong sell - 5 min candle
if the price above the VWAP and SMA20 lines and buy signal came then go for long if sell signal came below the VWAP and SMA20 line the go for short.
How does it work?
buy - take the buy order in next candle open's stop loss will be signal candle low
strong buy - take the buy order in next candle open's stop loss will be signal candle low
sell - take the sell order in next candle open's stop loss will be signal candle high
strong sell- take the buy order in next candle open's stop loss will be signal candle high
What are the signals?
Yes it will generate the buy/sell/strong buy/strong sell signals in the live market
these signal will plot up/down arrow based on signal.
Can we set the Alert on this?
Yes, we can set the alert based on the signals
Four custom alerts - NKP Buy , NKP strong Buy , NKP Sell, NKP Strong Sell
IMPORTANT: this script does not generate exit signals and those should be find using money management rules or else. Perfectly catches long runs in trends at all underlings (stocks, indexes ) at 5 min time frame. Lower/High period gives more incorrect signals and shorter runs on below 5 min period , higher period gives you late entry and less. Of course it gives false signals from time to time but fortunately it makes a correction very fast.
Try it! Good luck and good trading!
For access, please PM us or visit the link below in our Signature.
在脚本中搜索"buy sell"

NKP Buy Sell Signal Alert V1This great and simple buy / sell indicator based on EMA , VWAP , RSI , PSAR, MACD generates information about entry points at close of the candle. Strong Buy/ Sell signal is the best entry point but you can enter at the next candle.
we can see signals like buy/strong buy or sell/strong sell - 5 min candle
if the price above the VWAP line and buy signal came then go for long if sell signal came below the VWAP line the go for short.
buy - take the buy order in next candle opens SL will be signal candle low
strong buy - take the buy order in next candle opens SL will be signal candle low
sell - take the sell order in next candle opens SL will be signal candle high
strong sell- take the buy order in next candle opens SL will be signal candle high
IMPORTANT: this script does not generate exit signals and those should be find using money management rules or else. Perfectly catches long runs in trends at all underlings (stocks, indexes ) at 5 min time frame. Lower/High period gives more incorrect signals and shorter runs on below 5 min period , higher period gives you late entry and less. Of course it gives false signals from time to time but fortunately it makes a correction very fast. Try it! Good luck and good trading!
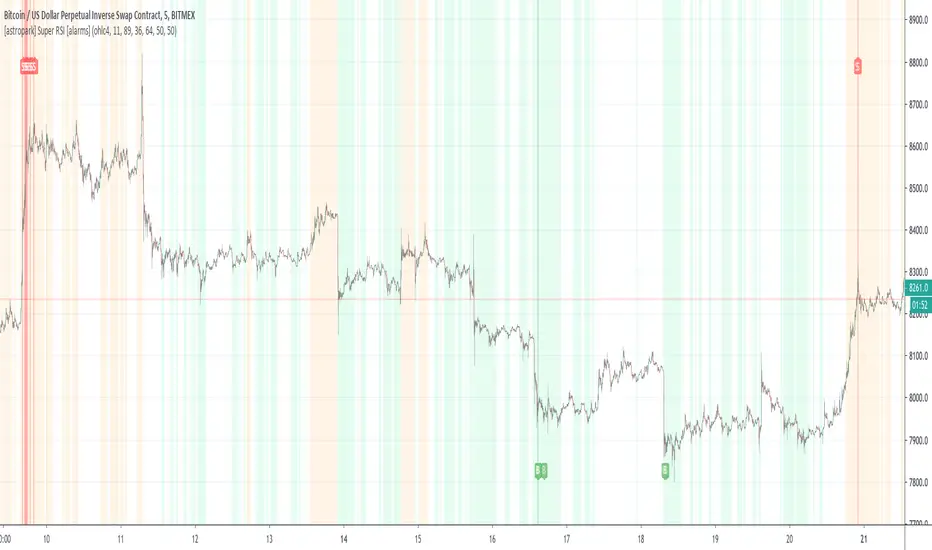
[astropark] Super RSI [alarms]Dear Followers,
today a new Scalper Tool , which works great on 3 minutes and 5 minutes timeframes , but also down to 1m and up to 30m!
I called it " Super RSI ", as it is based on RSI and inherits some basic functionality from it.
If you check its settings, you will see that you can have 3 different buy-sell sources (first two are active by default):
STRONG BUY/SELL : buy when white area deeply falls into oversold-red zone and sell when white area gets into overbought-green zone (you can set and edit at which level oversold and overbought zones start);
CROSSES : buy when the black RSI line in the middle between red and green area cross under the buy cross limit value and sell when it crosso over the sell cross limit value (you can set and edit specific cross ranges for both buy and sell);
WEAK BUY/SELL : buy when green area at least go below 50 level and sell when red area at least goes above 50 level (you can edit both levels); these conditions are highlighted as background color and are very useful for taking (at least partial) profits in trades.
By default the script will be placed as overlay on the chart, but
> you can activate the oscillator plot by disabling the "hide all plot" option
> and place it in a below pane by clicking on the black arrow at then end on the indicator name in chart and selecting "move to -> a new pane below"
This strategy can trigger till 10 buy or 10 sell signals in a row before reverting, so use a proper money management .
Strategy results are calculated on 20 trading days using 1000$ as initial capital and working at 10x leverage.
The user who wants to use this strategy, especially via an automated bot, must always set a stoploss at 3-5% from entry point or use a proper risk management strategy .
This is not the "Holy Grail", so use it with caution.
This script will let you set all notifications you may need in order to be alerted on each triggered signals.
The backtesting script version of this indicator, which will let you backtest this script and find best settings for your preferred market, can be found here below:
This is a premium indicator , so send me a private message in order to get access to this script .
kido-quarry metric 2018(buy/sell indicator)This is an indicator of when to buy/sell.
The blue background represents the current trend.
And, I tested the accuracy at 45 minutes,/4 hours,/1 days.
If you have any questions, please write to comments.
I would appreciate your feedback. :)

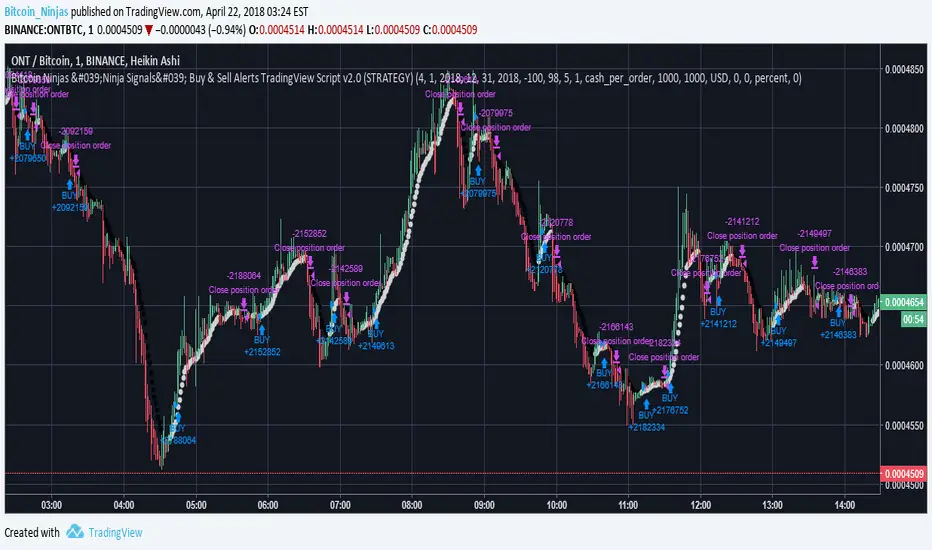
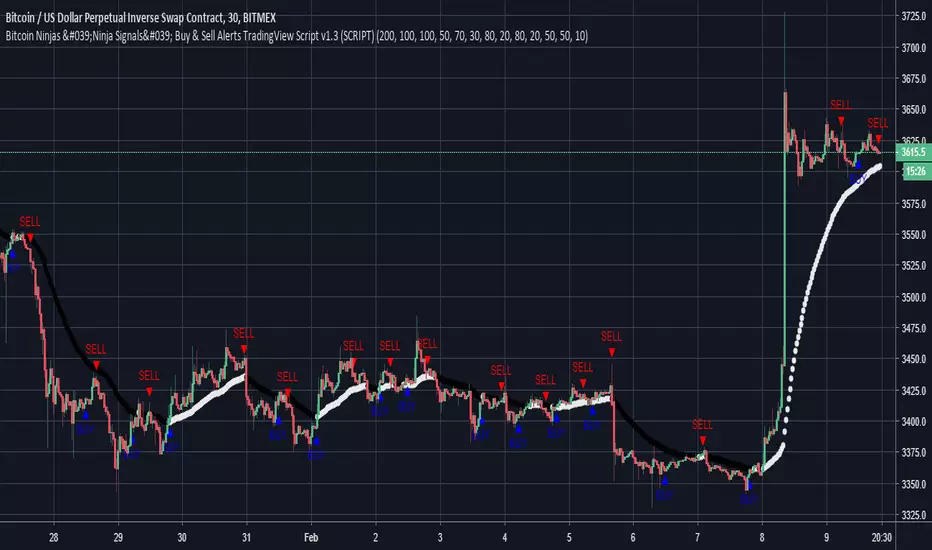
BitcoinNinjas Ninja Signals Buy/Sell Alert Trading Strategy v2.0Bitcoin Ninjas 'Ninja Signals' Buy/Sell Alerts & Backtesting TradingView Script v2.0
(for Cryptocurrencies, Forex, GunBot, ProfitTrailer, automatic trading software, and more)
'Ninja Signals' v2.0 (SCRIPT)
'Ninja Signals' v2.0 (STRATEGY)
'Ninja Signals' v1.0 (SCRIPT)
'Ninja Signals' v1.0 (STRATEGY)
-Allows users to easily set automated buy and sell alerts on TradingView for use with automatic and manual trading of cryptocurrencies, Forex securities, and more (alerts are compatible with automatic trading software such as GunBot, ProfitTrailer, and more).
-Synthesizes many powerful indicators [e.g. Relative Strength Index (RSI), stochastic RSI, Money Flow Index (MFI), Moving Average Convergence Divergence (MACD), etc.) into one super script to generate very precise buy and sell signals in almost any market condition.
-Buy arrows (blue) and sell arrows (red) can be changed or hidden for ease of viewing.
-No lag EMA trendline featuring trend-reversal color-coding (white uptrend, black downtrend).
-Adjustable ‘calibration’ setting allows users to customize the script to work for any currency or security available through TradingView, on any exchange, simply by adjusting a number.
-Complete with backtesting strategy version of script which allows users to test various buy and sell strategies based on the alerts the script generates (see info and screenshots below).
-Backtesting strategy incorporates a user-defined adjustable date range, so users can estimate the script’s performance over specific periods of time, such as the last day, week, or month.
-Backtesting strategy utilizes a minimum protective gain setting to help you never sell for a loss. Simply adjust your minimum profit (%) per trade, and the test results will update.
-Backtesting strategy allows for pyramid buying to test various average down / double up buying strategies. Simply adjust the number of pyramid buys and the quantity of each buy.
- Free 7-day trial available for TradingView users who join our free BitcoinNinjas community.
-Free 24/7 support via BitcoinNinjas Telegram GunBot support group with script purchase.
-Fully compatible with GunBot automatic trading software (TradingView plugin is required).
-Special discount available for traders who purchase GunBot automatic trading software and the GunBot TradingView plugin from BitcoinNinjas, allowing for fully automatic trading.
-Contact us via Email or Telegram for more information, to request additional / custom screenshots, or to start your free trial.
DISCLAIMER: By using this BitcoinNinjas document or ‘Ninja Signals’ planning script, you agree to the BitcoinNinjas 'Terms of Use', as presented on our website (www.BitcoinNinjas.org) and as stated here. No sharing, copying, reselling, modifying, or any other forms of use are authorized for our documents, script / strategy, and the information published with them. This informational document and planning script / strategy is strictly for individual use and educational purposes only. This is not financial or investment advice. Investments are always made at your own risk and are based on your personal judgement. BitcoinNinjas is not responsible for any losses you may incur. Please invest wisely.
Bitcoin Ninjas 'Ninja Signals' Buy & Sell Alert Trading ScriptBitcoin Ninjas 'Ninja Signals' Buy/Sell Alerts & Backtesting TradingView Script
(for Cryptocurrencies, Forex, GunBot, ProfitTrailer, automatic trading software, and more)
-Allows users to easily set automated buy and sell alerts on TradingView for use with automatic and manual trading of cryptocurrencies, Forex securities, and more (alerts are compatible with automatic trading software such as GunBot, ProfitTrailer, and more).
-Synthesizes many powerful indicators [e.g. Relative Strength Index (RSI), stochastic RSI, Money Flow Index (MFI), Moving Average Convergence Divergence (MACD), etc.) into one super script to generate very precise buy and sell signals in almost any market condition.
-Buy arrows (blue) and sell arrows (red) can be changed or hidden for ease of viewing.
-No lag EMA trendline featuring trend-reversal color-coding (white uptrend, black downtrend).
-Adjustable ‘calibration’ setting allows users to customize the script to work for any currency or security available through TradingView, on any exchange, simply by adjusting a number.
-Complete with backtesting strategy version of script which allows users to test various buy and sell strategies based on the alerts the script generates (see info and screenshots below).
-Backtesting strategy incorporates a user-defined adjustable date range, so users can estimate the script’s performance over specific periods of time, such as the last day, week, or month.
-Backtesting strategy utilizes a minimum protective gain setting to help you never sell for a loss. Simply adjust your minimum profit (%) per trade, and the test results will update.
-Backtesting strategy allows for pyramid buying to test various average down / double up buying strategies. Simply adjust the number of pyramid buys and the quantity of each buy.
-Free 7-day trial available for TradingView users who join our free BitcoinNinjas community.
-Free 24/7 support via BitcoinNinjas Telegram GunBot support group with script purchase.
-Fully compatible with GunBot automatic trading software (TradingView plugin is required).
-Special discount available for traders who purchase GunBot automatic trading software and the GunBot TradingView plugin from BitcoinNinjas, allowing for fully automatic trading.
-Contact us for more information, to request additional / custom screenshots, or to start your free trial.
DISCLAIMER: By viewing and/or using this TradingView script, you agree to the BitcoinNinjas 'Terms of Use', as presented on our website and as stated here. No sharing, copying, reselling, modifying, or any other forms of use, are authorized for this document. This document is strictly for individual use and informational purposes only. This is not financial or investment advice. Investments are always made at your own risk, and are ba
BUY & SELL Probability (M5..D1) - MTFMTF Probability Indicator (M5 to D1)
Indicator — Dual Histogram with Buy/Sell Labels
This indicator is designed to provide a probabilistic bias for bullish or bearish conditions by combining three different analytical components across multiple timeframes. The goal is to reduce noise from single-indicator signals and instead highlight confluence where trend, momentum, and strength agree.
Why this combination is useful
- EMA(200) Trend Filter: Identifies whether price is trading above or below a widely used long-term moving average.
- MACD Momentum: Detects short-term directional momentum through line crossovers.
- ADX Strength: Measures how strong the trend is, preventing signals in weak or flat markets.
By combining these, the indicator avoids situations where one tool signals a trade but others do not, helping to filter out low-probability setups.
How it works
- Each timeframe (M5, M15, H1, H4, D1) generates its own trend, momentum, and strength score.
- Scores are weighted according to user-defined importance and then aggregated into a single probability.
- Proximity to recent support and resistance levels can adjust the final score, accounting for nearby barriers.
- The final probability is displayed as:
- Histogram (subwindow): Green bars for bullish probability >50%, red bars for bearish <50%.
- On-chart labels: Showing exact buy/sell percentages on the last bar for quick reference.
Inputs
- EMA length (default 200), MACD settings, ADX period.
- Weights for each timeframe and component (trend, momentum, strength).
- Optional boost for the chart’s current timeframe.
- Smoothing length for probability values.
- Lookback period for support/resistance adjustment.
How to use it
- A green histogram above zero indicates bullish probability >50%.
- A red histogram below zero indicates bearish probability >50%.
- Neutral readings near 50% show low confluence and may be best avoided.
- Users can adjust weights to emphasize higher or lower timeframes, depending on their trading style.
Notes
- This script does not guarantee profitable trades.
- Best used together with price action, volume, or additional confirmation tools.
- Signals are calculated only on closed bars to avoid repainting.
- For testing and learning purposes — not financial advice.

RED: Buy, Sell & TargetsRED: Buy, Sell & Targets
What it is
- Buy & Sell Alerts — a multi-factor scoring engine that highlights potential reversal/exhaustion areas for both longs and shorts.
- Buy & Price Target — a bottom-finder that proposes the nearest meaningful upside target and tracks hits.
Both modules can be toggled independently in the settings; they’re enabled by default.
How to read the chart
1) Buy/Sell panel (scored signals)
- Each bar receives a Buy score and a Sell score from 0 to 10.
- When the score passes the adaptive threshold, you’ll see:
A transparent label (hover to see a checklist tooltip).
If the score is very high, a colored badge with the number appears near the bar.
- Color intensity ≈ conviction (deeper green/red = stronger confluence).
- Small dots mark qualified signals with scores below the “very high” tier.
Score interpretation (rule of thumb)
- 7+: Valid setup (moderate confluence).
- 8+: Stronger confluence.
- 9–10: High-conviction / rare events.
The minimum score to confirm a signal adapts to the timeframe; higher timeframes naturally demand comparable or slightly lower scores.
Note: On symbols without usable volume, you’ll see a top-right warning and the maximum possible score becomes 9.
2) Buy & Target panel (entries + exits)
- When a qualified bottom is detected and the nearest overhead structure offers enough room, a BUY label shows:
💰 Entry (close of the signal bar)
🎯 Target (nearest pivot-based objective above price)
- When price tags the target later, the script prints a 🎯 exit marker above that bar.
- A live stats table (top-right) summarizes Buys, Wins, Open trades, Win rate, Net P&L % for these target plays.
Alerts
This indicator ships with multiple alert conditions, including:
- Buy/Sell score tiers (e.g., “BUY ≥ 9”, “SELL ≥ 9”)
- Target module (“🎯 BUY (target ≥3%)”, “🎯 Target reached”)
Important: The checkboxes in settings only authorize alerts to fire; you still need to create alerts in TradingView and choose the desired condition.
Practical tips
- Prefer bar close for decisions and alerts to reduce noise.
- Cross-check signals across multiple timeframes (e.g., daily with intraday).
- Use the score as a confidence meter, not as an all-in trigger; combine with your risk management.

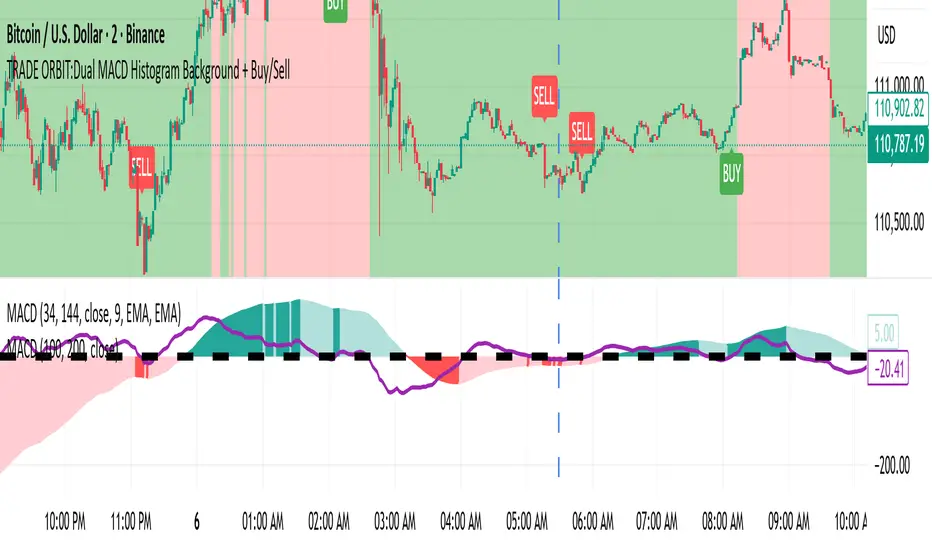
TRADE ORBIT:Dual MACD Histogram Background + Buy/SellDescription:
This indicator combines two MACD systems to provide clear trend, buy/sell signals, and identifies potential discount and premium zones for smarter entries and exits.
Features:
MACD #1 (100, 200, 50) – Trend & Background Coloring
Histogram > 0 → Green background (Bullish trend)
Histogram < 0 → Red background (Bearish trend)
MACD #2 (34, 144, 9) – Buy/Sell Signals
Buy Signal: Histogram crosses above zero and MACD #1 background is green
Sell Signal: Histogram crosses below zero and MACD #1 background is red
Signals are plotted as tiny labels directly on the chart
Discount & Premium Zones
Discount Zone: Price below MACD #1 slow EMA → highlighted in green
Premium Zone: Price above MACD #1 slow EMA → highlighted in red
Helps identify “cheap” (potential buy) and “expensive” (potential sell) areas relative to trend
Reference Plots (Optional)
MACD #1 & #2 histograms plotted as columns for visual confirmation
Usage:
Use MACD #1 background to identify the prevailing trend.
Wait for MACD #2 cross signals aligned with trend for buy/sell confirmation.
Discount and premium zones help time entries and exits more efficiently.
Ideal For:
Swing traders and position traders who want to combine trend-following signals with overbought/oversold zones.
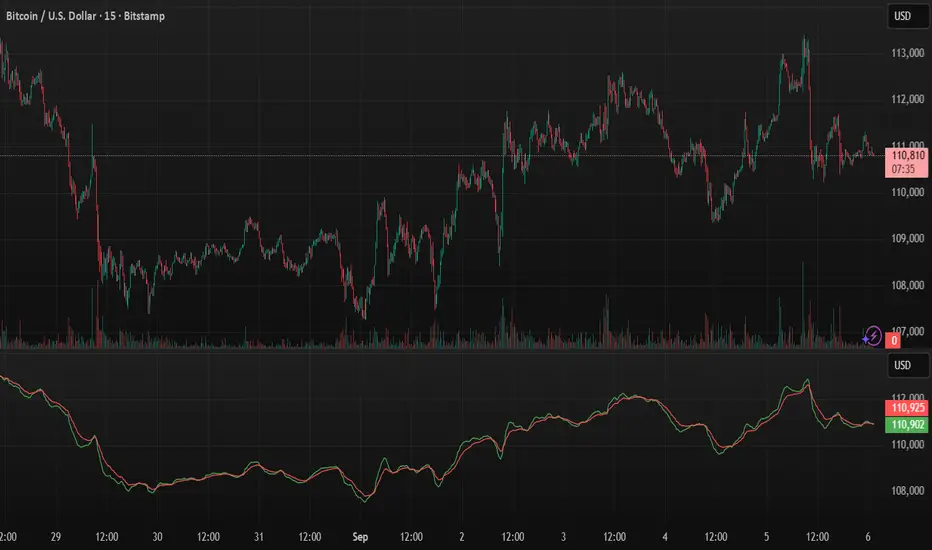
sHip Crypto Buy/Sell Pro BTC 15minThis is a 15min BTC buy sell indicator that is made by Ai. Have not tested yet but you can give it a go if you want.
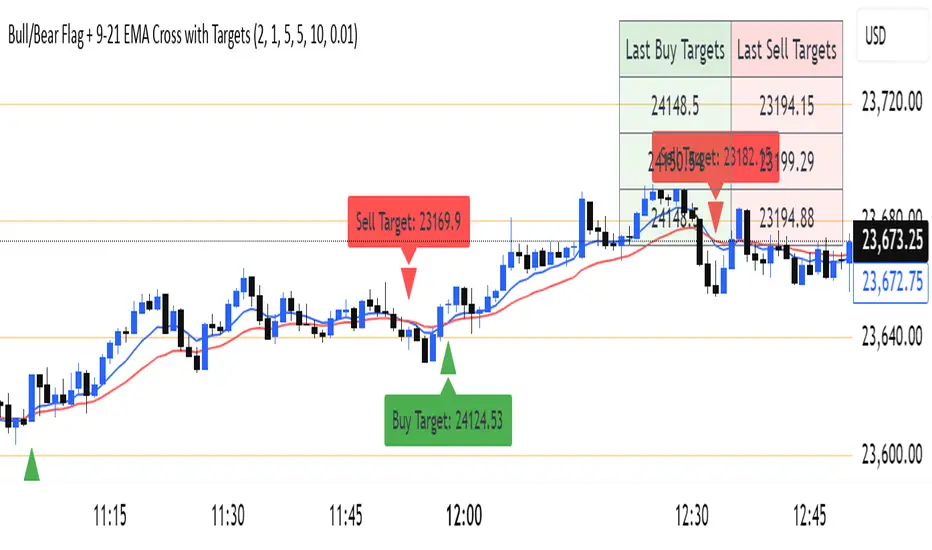
Bull/Bear Flag + 9-21 EMA Cross with Targetssimple chart indicator help with buy sell targets using bear and bull flag along with moving averages on chart -helpful for beginner traders

Trendline + Bull/Bear Flag + EMA 9/21 Buy-Sell Signalseasy scalping and buy sell signals on 9-21 ema cross and trendline breakout

AlgoFlex Buy Sell Signal (1h only)
**Overview**
AlgoFlex Scalper plots buy/sell signal markers using:
* a range filter (EMA of absolute bar changes) to define short-term bias,
* an Adaptive Moving Average (AMA) slope to confirm direction, and
* an ATR threshold to filter weak momentum.
Signals are evaluated on bar close to reduce intrabar noise. This is an indicator, not a strategy.
**How it works (concepts)**
* Range filter: smooths price with an EMA-based range measure and forms upper/lower bands.
* Trend state: counts consecutive movements of the filtered series (up/down counters) to avoid whipsaws.
* AMA + ATR gate: rising AMA with change > ATR \* atrMult can produce a long signal; falling AMA with change < -ATR \* atrMult can produce a short signal.
* TP/SL markers: projected using ATR multiples (tpMult, slMult). Visual guides only.
* Buy Signal, Sell Signal, plus optional TP/SL notifications. Designed to fire on bar close.

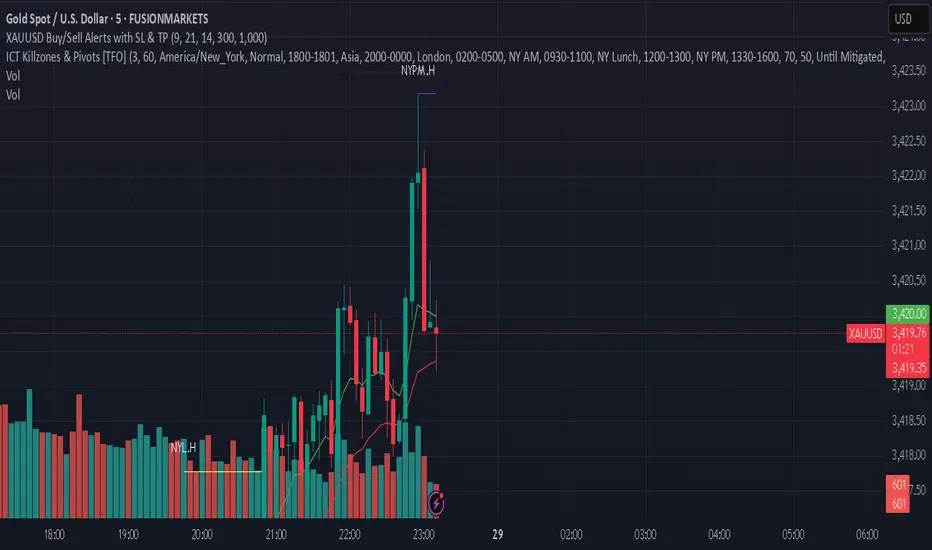
XAUUSD Buy/Sell Alerts with SL & TPThis custom TradingView indicator identifies high-probability buy and sell signals on XAUUSD using EMA crossovers combined with RSI confirmation. Designed for precision entries, it automatically calculates optimal Stop Loss (SL) and Take Profit (TP) levels based on user-defined pip distances.
Key Features:
Fast and Slow EMA crossover for trend direction
RSI filter for momentum confirmation
Dynamic SL and TP levels to manage risk and reward
Visual buy/sell signals plotted on chart
Real-time alerts with detailed messages including entry price, SL, and TP
Suitable for multiple timeframes and trading styles
Perfect for traders seeking clear signals with built-in risk management for scalping or swing trading XAUUSD.
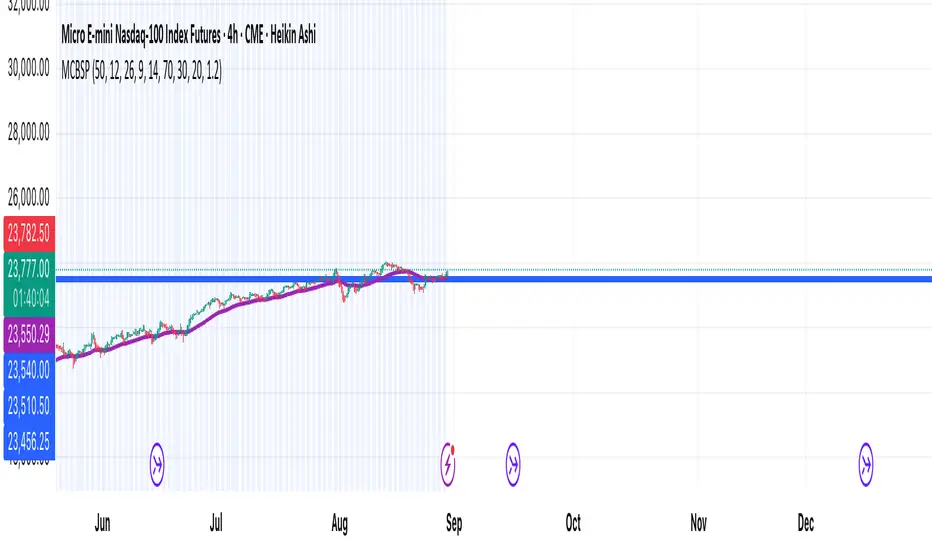
Multi-Confirm Buy Sell Pulse (MCBSP)The MCBSP generates repeat buy/sell signals using four combined filters: EMA trend direction, MACD histogram momentum, RSI for overbought/oversold, and volume confirmation. Green “BUY” and red “SELL” labels appear on the exact signal bar, allowing for frequent trades. Alerts are included for automation or notifications. Visual cues are compact—no background overlays or excessive lines
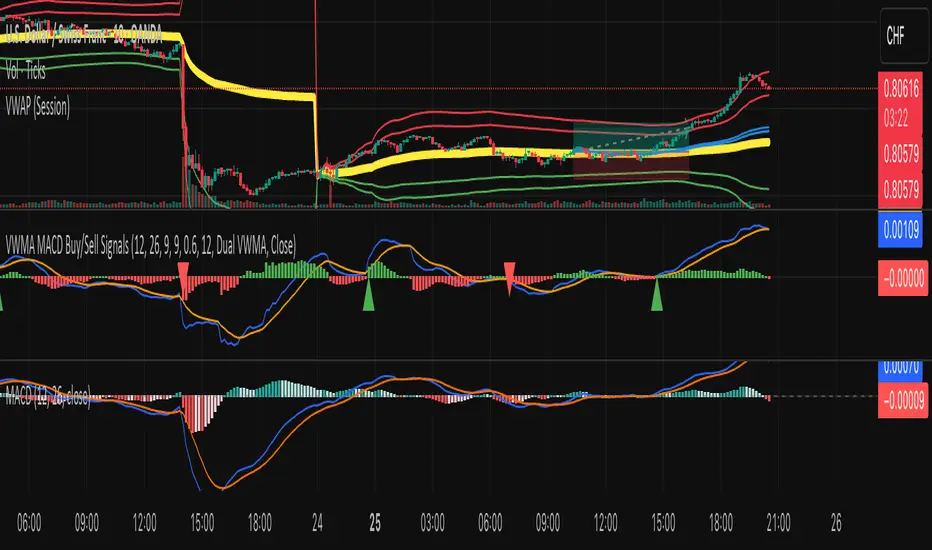
VWMA MACD Amanita Buy/Sell Signals VWMA MACD Amanita Buy/Sell Signals – Volume-Weighted Momentum Indicator
A twist on the classic MACD: this indicator uses Volume Weighted Moving Averages (VWMA) instead of EMAs, giving more weight to price moves backed by higher volume.
Features:
VWMA-based MACD line & signal line
Histogram highlights bullish/bearish momentum
Color-coded for easy visualization
Quick Guide:
MACD above Signal → bullish
MACD below Signal → bearish
Rising histogram → strengthening trend
Falling histogram → weakening trend
Perfect for traders who want momentum confirmed by volume.
OHLC Horizontal Compact + Volume + Buy/SellA compact, single-row horizontal table for TradingView displaying Open, High, Low, Close (OHLC), net change, percentage change, volume, and buy/sell pressure percentages. The table is fully color-coded for easy interpretation: green for positive values, red for negative, and yellow for neutral. Table position is fully customizable (top, middle, bottom / left, center, right). Ideal for traders who want a concise, real-time snapshot of price action and market sentiment in a single row.
Features:
OHLC values in one horizontal row
Net change (Δ) and % change with directional arrows
Real-time volume display
Buy/Sell pressure % with dynamic coloring
Fully customizable table placement
Works on all timeframes

RCI Buy/Sell Signals RCI Buy/Sell Signals — Dual-RCI State Machine with EMA Bias (Protected)
A purpose-built signal tool that combines two RCI horizons with a deterministic state machine and an EMA-based background bias. It is not a simple mashup: the components are designed to work together so that trend context, timing, and exits form a coherent workflow.
The code remains closed-source to protect a proprietary implementation; this description explains what it does and how the pieces interact so traders can evaluate it.
What it does
On-chart signals: Marks potential BUY/SELL entries and EXITs directly on the chart (markers are drawn with a −1 bar offset for readability).
Trend bias at a glance: Background shading reflects EMA context:
Green when price is above both EMA1 and EMA2
Red when price is below both EMA1 and EMA2
No shading otherwise
(EMA lengths and timeframes are user-configurable.)
Deterministic state machine: Ensures only one active side at a time (flat → long/short → exit), so entries/exits do not overlap or contradict each other.
How it works (conceptual)
Two-horizon RCI framework:
A MID-RCI monitors regime transitions using mid-range thresholds.
A LONG-RCI acts as a slower directional filter/validator.
Two timing modes (you can enable either or both):
Steadily — MID-RCI transitions across mid-band thresholds (e.g., around −50/50) govern entries; LONG-RCI direction is used to confirm/align.
Above — LONG-RCI crosses its pivotal level (around zero) with directional agreement.
These modes are integrated—not stacked randomly—so that one provides timing, the other directional context.
Exits & risk guard: Exits trigger on MID-RCI reaching extreme bands (e.g., ±85) or when price violates a simple N-bar extremum stop (default: 20-bar low/high), whichever comes first. This makes exits explicit rather than relying on a trailing overlay.
Why this is not “just a merge”
The EMAs are not a separate indicator pasted on top; they only provide a binary bias that gates background shading and helps filter entries visually.
The RCI pair is functionally split (timing vs. confirmation) and then synchronized through a state machine that prevents conflicting signals and enforces clean transitions.
The script ships with signal placement discipline (−1 offset markers for clarity) and built-in exit logic based on RCI extremes plus a simple context stop—an integrated design choice, not an ad-hoc mix.
Inputs (overview)
Display: Show Entry Signals / Show Exit Signals / Show Background
Context: EMA1/EMA2 lengths & timeframes (background bias only)
RCI: Long/Mid lengths and source
How to use
Apply the script on a clean chart (no other indicators unless you explain why).
Use the background color as high-level bias, then use the on-chart signals for timing.
Optionally set alerts with “Any alert() function call” to receive signal notifications.
Confirm with your own risk management, liquidity checks, and higher-timeframe confluence.
Notes on publication (for moderators & traders)
Closed-source rationale: The specific RCI ranking/threshold scheme and the state-machine selection logic are part of ongoing proprietary research; the code is protected.
This description details the concepts and interactions sufficiently to understand what the script does and how components work together, while preserving implementation specifics.
Disclaimer
For educational/informational purposes only; not financial advice. Test thoroughly before live use. Trading involves risk.

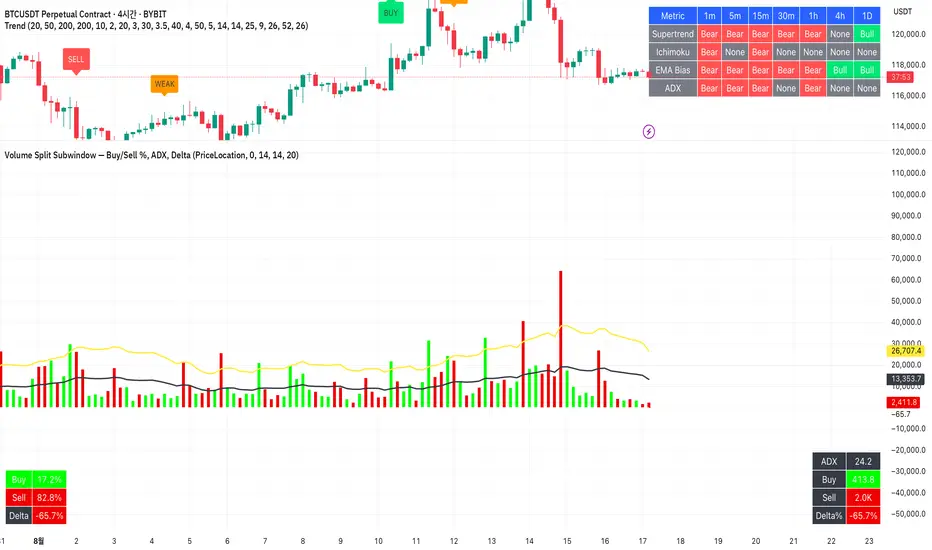
Volume Split Subwindow — Buy/Sell %, ADX, DeltaThis script splits each candle’s volume into **buy vs sell portions** (teal = buy, red = sell).
It plots a **volume histogram** with moving average lines (MA and 2×MA) for breakout detection.
Two side panels show **Buy/Sell %, Delta, ADX, and absolute buy/sell volumes** for quick analysis.
KhoiHV - Bollinger Bands Buy/Sell Area ProBollinger Bands Buy/Sell Area Pro is a professional-grade indicator designed to identify potential trading opportunities based on Bollinger Bands. It highlights dynamic buy and sell areas by combining price action with volatility, helping traders quickly visualize market conditions.
✨ Key Features
Automatically plots upper, middle, and lower Bollinger Bands.
Marks Buy Areas when price enters oversold zones near the lower band.
Marks Sell Areas when price enters overbought zones near the upper band.
Configurable inputs for length, source, and multiplier to fit any trading style.
Easy-to-read chart visuals with colored zones for instant recognition.
💡 How to Use
Look for Buy Areas near the lower band in trending markets to catch potential rebounds.
Watch for Sell Areas near the upper band to anticipate possible pullbacks.
Combine with volume, momentum, or trend indicators for stronger confirmation.
This tool is especially useful for traders who want a clear, visual edge in spotting volatility-based entries and exits without constantly recalculating signals.
Cvd Divergence Signals with filter.
CVD Divergence + Candles - False Signal Filter
Hey traders,
I want to share my custom indicator with you. Through testing, I've found that CVD (Composite Volume Delta) captures divergences much more accurately than traditional tools like RSI. But this isn't just another divergence indicator - I've added strict candlestick pattern confirmation to filter out false signals. I'll keep improving this tool over time, and I welcome all your suggestions in the comments.
How it works step-by-step:
1. First, it detects CVD divergences (the delta between buy/sell volumes)
2. Then confirms each signal with reversal candlestick patterns:
- Hammer/Hanging Man
- Engulfing
- Pin Bar
- Inside Bar
Why mine beats standard CVD indicators:
• No raw divergences - only shows signals confirmed by BOTH volume AND price action
• Eliminates 80% of junk signals from basic versions
• Adaptable to any asset and timeframe
Simple usage guide:
Green arrows = Buy when:
- CVD shows bullish divergence
- AND a hammer/pin bar appears
Red arrows = Sell when:
- CVD shows bearish divergence
- Confirmed by hanging man/engulfing pattern
Pro tip:
For best results, combine with:
• Volume profile analysis
• Smart Money concepts (order blocks, FVGs )
Important notes:
This isn't a holy grail - I personally use it with support/resistance levels. Works best on 5M charts for scalping.
**PS** Got questions? Drop them in comments!
